Ramprabhu's AI Den
Sunday, November 15, 2020
Wednesday, October 7, 2020
Sunday, August 30, 2020
Iterable and Iterator in Python using Aladdin story.
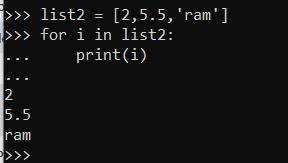
Generally we use for-loops to iterate or traverse across the elements within a List or Tuples.
In the for-loop after processing the first element in the list control moves to the next element , this process of traveling from one element to other is called Iteration. For loop works in the same way for Tuples, Dictionaries, Strings and Sets.
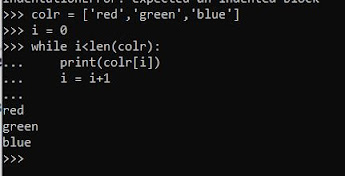
There are two ways to do the same iteration process without using For-Loop. The first method is Indexing
But this indexing method can be used only for List,Tuples and strings.They cannot be used for Sets and Dictionaries because they are unordered.
Iterator Protocol:
The second method we can use is Iterator protocol. Iterator protocol is nothing but working with Iterator and Iterable. Most of us are confused with these two terms Iterable and Iterator.
Let’s have a close look at them now.
Everything that we can loop over is called a Iterable. In the above fig of for Loop list is an iterable.
Now these Iterables do give us the Iterators. They do give these iterators using a function Iter().Iterable usually call this Inbuilt function iter() and generate the Iterator. Using this Iterator we can traverse across the individual elements in the Iterable.
Let’s use our friend Aladdin to explain this Iterable concept.
Consider Aladdin as the Literable and the Genie as the iterator which does things for Aladin.Aladdin brings the Genie out using the Magic lamp, so now the magic lamp is our ITER() object.
Aladdin → Iterable
Magic Lamp → Iter()
Genie → Iterator
In the above example the list is the iterable and it uses the iter(list) function to create an iterator for list. Now we can use the Next(iterator) to extract individual element of the iterable.
Let's meet again for another post on Generators.
Tuesday, April 28, 2020
Apache Spark Architecture and processing in breif
Monday, April 20, 2020
Friday, April 17, 2020
Chi-Square test for Dependency between categorical variables( Independent and target variable)
A most common problem we come across Machine learning is determining whether input features are relevant to the outcome to be predicted. This is the problem of feature selection.
|
|
High School
|
Bachelors
|
Masters
|
Ph.d.
|
Total
|
|
Female
|
60
|
54
|
46
|
41
|
201
|
|
Male
|
40
|
44
|
53
|
57
|
194
|
|
Total
|
100
|
98
|
99
|
98
|
395
|
- If Statistic >= Critical
Valuesignificant
result, reject null hypothesis (H0), dependent.
- If Statistic < Critical
Valuenot
significant result, fail to reject null hypothesis (H0), independent.
- If p-value <= alphasignificant result, reject
null hypothesis (H0), dependent.
- If p-value > alphanot significant result, fail
to reject null hypothesis (H0), independent.
Monday, March 16, 2020
TF-IDF algorithm ( Natural Language Processing)
TF-IDF stands for Term frequency and inverse document frequency and is one of the most popular and effective Natural Language Processing techniques. This technique allows you to estimate the importance of the term for the term (words) relative to all other terms in a text.
CORE IDEA: If a term appears in some text frequently, and rarely in any other text – this term has more importance for this text.
- TF – shows the frequency of the term in the text, as compared with the total number of the words in the text.
- IDF – is the inverse frequency of terms in the text. It simply displays the importance of each term. It is calculated as a logarithm of the number of texts divided by the number of texts containing this term.
- Evaluate the TF-values for each term (word).
- Extract the IDF-values for these terms.
- Get TF-IDF values for each term: by multiplying TF by IDF.
- We get a dictionary with calculated TF-IDF for each term.
- Unimportant terms will receive low TF-IDF weight (because they are frequently found in all texts) and important – high.
- It is simple to evaluate important terms and stop-words in text.
-
As we know, Spark runs on Master-Slave Architecture. Let’s see the step by step process 1.First step the moment we submit a Spa...
-
TF-IDF: TF-IDF stands for Term frequency and inverse document frequency and is one of the most popular and effective Natural Language ...


